Reliability analysis of nuclear power plant auxiliary systems
15. Máj, 2017, Autor článku: Halaj Marián, Elektrotechnika
Ročník 10, číslo 5  Pridať príspevok
 This article deals with the numerical reliability analysis of nuclear power plants auxiliary power distribution systems, specialliy for presurised water reactor (PWR) with four parallel operated divisions (300% active redundancyof main electrical systems. Contrary to the most of similar studies this one is performed with respect to the dynamic aspects of system operation instead of only static failure rate calculation of the system configuration.
Introduction
A reliable and safe operation has been one of the major design issues since the nuclear power plants (NPPs) have been introduced. As opposite to the severe consequences in case of post accident scenario there is, however a need to consider the economical aspects as well. Generally, i tis assumed that around 50% of investment costs are being spent on safety systems. Even if these costs are really enormous the power distribution system of presently designed NPPs are still based on the concept developed in 60’s and 70’s. This article provides the resuls of auxiliary power distribution system analysis within presurized water reactor based NPP, particularly with the main medium and low voltage power distribution systems in NPP with four paralel operated divisions.
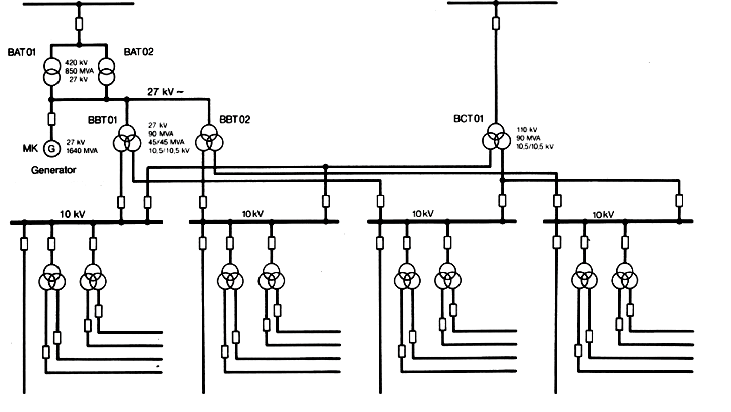
Figure 1: Single line diagram of NPP – medium voltage part
A basic concept of NPP with four divisions is described on Figure 1. In normal plant operation mode the electric power to the auxilary consumers (e.g. pumps, fans, control system, etc.) is fed either from generator G or from external 400kV network via step-up transformers BAT01/BAT02. Plant start-up is also provided by means of 400kV network. In case of accident causing a non-availabity of this power supply the plant emergency shut-down as well as the long term operated emergency systems are supplied from 110kV stand-by supply via transformer BCT01. Secondary terminals of transformers BBT and BCT therefore, form an interface between common part of auxiliary systems and four independent divisions. These four divisions ensure a safe operation of the plant by means of redundancy . Redundancy means that in case of maintenance or failure of even three divisions in the same time the remaining one is still capable to perform the plant operation. Presented single line diagram takes into consideration so called „normal power supply system“ of the plant that is not secured neither by diesel-generators nor by batteries. These systems are not included withen presented paper.
Method
There are many reliability analyse methods developed, however for this particular study the two of them have been chosen. It is a fault tree analyse (FTA) and event tree analyse (ETA). The basis of FTA is a modelling of any electrical device (e.g. cable, busbar, etc.) as a component of reliability scheme. A suitable example is a modeling of two transformers in parallel or a serial model to describe power flow between two different nodes of distribution system via set of cables and busbars.
As opposite to FTA the ETA method does not consider the device itself but, rather a set of failure states that can occure on the analysed power system. In some particular cases the results of the two analyses (numerical values of failure rate) could be the same, however this is not the rule. An example of ETA may be found in protective relay fail to trip and consequences given by tripping of back-up (upstream) one.
While the FTA fault tree is mainly based on standardized mathematical equations (1.1-1.3) used in reliability theory [1], [2] the ETA fault tree requires deep knowledge of system operation. Therefore the FTA is used to provide some partial results as entry data for overall study. Another use of FTA is to calculate the static system reliability. These results are further used to compare with real calculation using the ETA to see the impact of dynamic events on system reliability. Equation (1.1) represents a „serial“ failure model. In this case a failure of the system is caused by failure of any of its components (1.2)
") |
(1.1) |
Qs is a probability of system failure state, Qi is a probability of failure state of i-th component, x’1 is a failure state
") |
(1.2) |
As opposite to serial model a parallel model represented by equation (1.3) is case where a system breakdown is caused by failure of all its components.
 |
(1.3) |
For illustation the principle of ETA shown on Figure 2. A system comes if failure state in case of all four divisions are in failure state (redundancy). This situation is represented by logical gate AND (&). Detail description of power supply loss in any of four divisions is described on Figure 3. Gate OR (1) represents the state when subsystem comes in failure even if one of it’s components fails. Diagram on Figure 2, however does not consider the common power distribution part of plant auxiliary system.
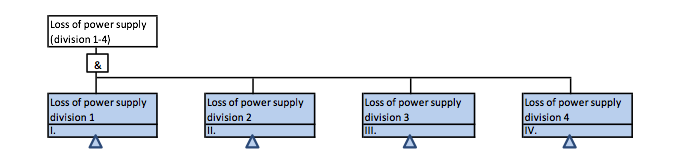
Figure 2: Principle of redundancy
Figure 3 shows the partial failure tree of the system – failure tree of single division. Result of calculation according this failure tree may be compared with the results of overall system calculation in order to see the influence of redundancy on system reliability.
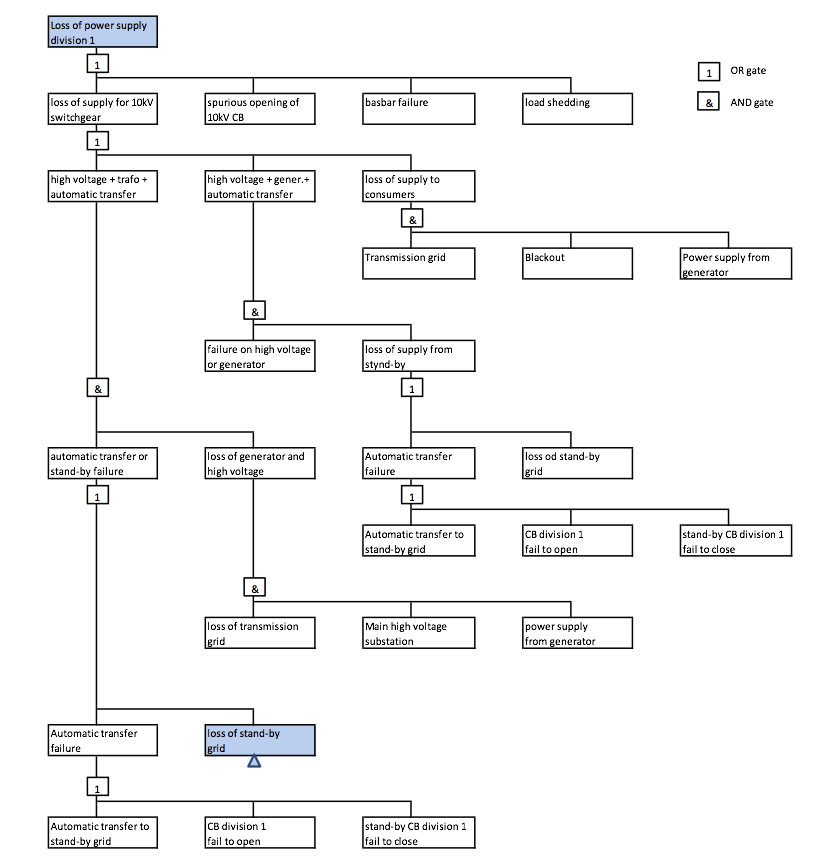
Figure 3: Fault tree of one division
Figure 4 shows the overall failure tree of the system. In general a system breakdown may becaused by loss of power supply, by malfunction of load shedding system or due to simultaneous failure in all four divisions that is, however very unlikely scenario. A load shedding is a very complex system consinting of many instrumentation and controls devices used to control the power components of the system.
Since the whole system is built to resist the single failure at least two simoltaneous failures are considered to cause the system breakdown. Primary failure is linked with the loss of power supply from generator or main 400kV grid. It might be caused either due to fault of power component or by operational reasons. Secondary failure is reated to the loss of stand-by power supply. It might by caused by malfunction of automatic transfer to stand-by power supply or due to loss of voltage in stand-by 110kV network.
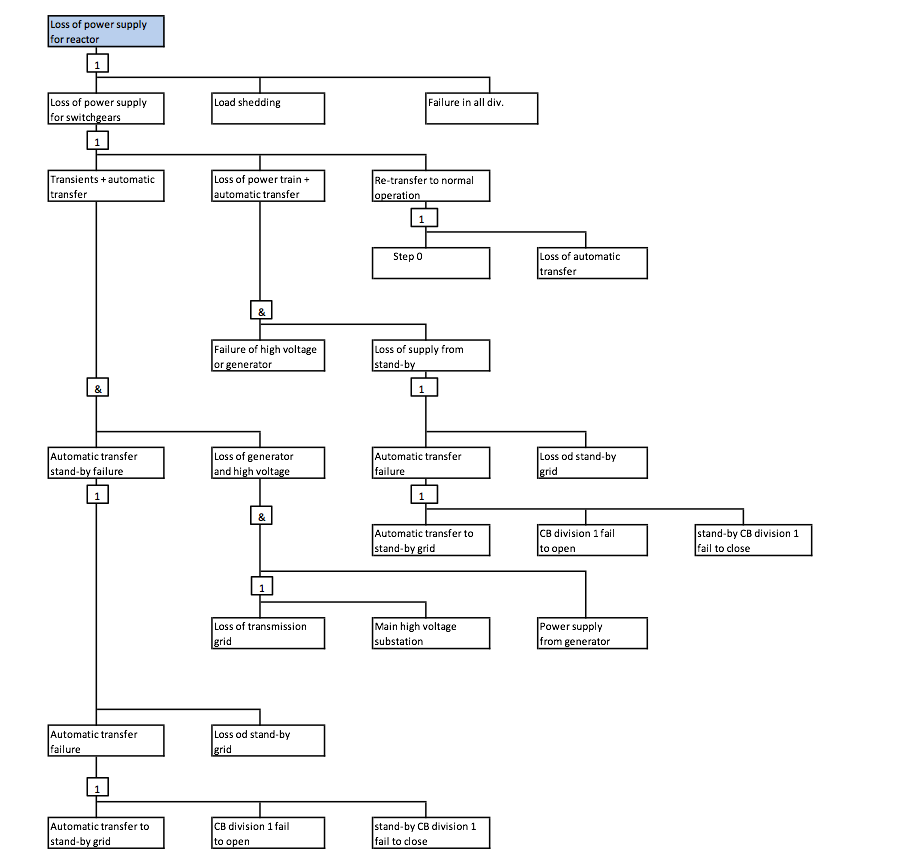
Figure 4: Fault tree of the system
Entry data for calculation
Entry data for the culculation have been taken from [3], [4].
Table 1 Failure rate of system components
| Component | Failure rate [h-1] | MTTR [h] | Q [-] |
|---|---|---|---|
| Medium voltage switchgear | 4,93E-7 | 12,5 / 20 | 6,16 / 9,86E-6 |
| Circuit breaker | 2,00E-7 | 2 | 2 |
| Generator circuit breaker | 1,34E-6 | 24 | 24 |
| Unit step-up transformer (single phase) | 1,28E-6 | 46 | 46 |
| Auxiliary transformer | 1,70E-6 | 12,5 | 12,5 |
| Diesel-generator (fail to start) | 3,63E-3 | 20 | 20 |
| Back-up auxiliary transformer | 1,70E-6 | 15 | 15 |
| Protective relays | 8,00E-7 | 2 / 10 / 20 | 2 / 10 / 20 |
Results
The caculation have been performed using MS Excel and Matlab with the results presented in Table 2.
Tab. 2 Results of system failure state probability
| Situation | Probability of system failure state Q [-] |
|---|---|
| One division failure | 2,63449E-05 |
| Static calculation | Q=2,0437E-08 |
| System failure | 5,63756E-06 |
Conclusion
The results of the analysis without consideration of dynamic aspects show the extremely low level of system failure state probability (Q=2,0437 10-8 [-]) that is around two decimal places lower comparing the study with consideration of dynamic aspects (Q=5,63756 10-8 [-]). It means that operation of the plant may increase a failure probability around 50 times more comparing to static calculation that is usual way of system reliability study.
Components that mostly influent the failure rate of the system are a load shedding including the busbar voltage measurement and automatic bus transfer to stand-by grid. Another important aspect is the existence of generator circuit breaker in the power train (between generator and main step-up transformer). Although the basbar failure has a dominant impact on failure rate of one division, from the overall system point of view is it’s impact negligible. The study have taken also the double busbar system into consideration, however implementation of such a solution seems not be reasonable from the economical point of view, because the reliability improvement is negligible too.
Sensibility analyses (entering of various value of component failure probability in calculation formulas ) for any of the investigated subsystems haven’t proofed an important impact of entry data on the caclulated failure rate of overall system. A significant change of calculated system failure rate occurs usually only after entry data change of two or three decimal places. It has to be reminded that a study has been focused on „non-secured“ part of the plant auxiliary systems, means back-up batteries and diesel-generators are excluded from the study.
References
- RAUSAND, M. – HOYLAND, A.: System Reliability Theory: Models and Statistical Methods. Second Edition. John Wiley & Sons, 2004. ISBN 0-471-47133-X.
- TUMA, Jiří – RUSEK, Stanislav – MARTÍNEK, Zbyněk – TESAŘOVÁ, Miroslava – CHEMIŠINEC, Igor: Security, quality and reliability of electrical energy. Conte spol. s.r.o., ČVUT Praha, 2007 172 s. ISBN 978-80-239-9056-0
- Applied R&M Manual for Defence Systems [online]. Dostupné na internete:
www.sars.org.uk - Survey of Reliability and Availability Information for Power Distribution, Power Generation, and Heating, Ventilating and Air Conditioning (HVAC) Components for Commercial, Industrial, and Utility Installations. Headquarters, Department of the Army, 22 July 2006. 38 p.