Simulation of Generator Loading
01. Júl, 2013, Autor článku: Heretík Peter, Elektrotechnika
Ročník 6, číslo 7  Pridať príspevok
![]() The main purpose of this paper is to examine properties of electrical machines. Calculations and simulations are aimed to a synchronous generator. For dynamic calculations are used data of these machines provided by real manufacturers as an input for program ETAP. Simulation results from ETAP are compared to manual calculation and to the value provided by manufacturer.
The main purpose of this paper is to examine properties of electrical machines. Calculations and simulations are aimed to a synchronous generator. For dynamic calculations are used data of these machines provided by real manufacturers as an input for program ETAP. Simulation results from ETAP are compared to manual calculation and to the value provided by manufacturer.
1. Introduction
Important issues for analyzing the synchronous generator are analyses of the load characteristic, the step-load sequence and the device regulating the speed of the generator, the governor. In step-load sequence chapter are analyses of behavior of the generator (mechanical and electrical power of the generator, speed of the generator) at connecting more loads with small time step. Response of the generator to connecting loads is influenced by the reaction of the governor, which is examined in isochronous (speed maintained at constant value) and droop mode (characterized by decrease in speed or frequency, proportional to load).
2. ETAP
ETAP (Electrical Transient Analyzer Program) is the most comprehensive analysis platform for the design, simulation, operation, and automation of generation, distribution, and industrial power systems [1]. ETAP is developed under an established quality assurance program and is used worldwide as a high impact software. It is completely localized in four languages with translated output reports in six languages. ETAP’s quality assurance is specifically dedicated to meeting the requirements of:
- ISO 9001:2008 Standards
- United States Code (U.S.C.) Title 10 CFR 50, Appendix B
- United States Code (U.S.C.) Title 10 CFR 21
- ANSI/ASME N45.2-1977
- ASME NQA-1 (Incl. Subpart 2.7)
- ANSI/IEEE 730.1-1989
- CAN / CSA-Q396.1.2-1989
- ANSI N45.22-1972 [2]
3. Parameters of synchronous generator
Electrical data of synchronous generator are provided by manufacturer in datasheet. Datasheet is a document created by the manufacturer used to summarize electrical data of an electrical product or machine. These data are necessary for integrating the component into a system. It includes technical parameters (e.g. power, voltage, efficiency or power factor) which are used for dynamic calculations.
3.1 Synchronous generator
Electrical data of generator contains important information about rated values as a voltage, power factor, efficiency etc. Data about type of generator that we have to know for working with it, as a number of poles, direct-axis synchronous reactance, negative sequence resistance. In some electrical data of generator should be also included information like driving machine or climate. An example of electrical data of generator is in Tab. 1.
Tab. 1. Electrical Data of generator [4]
| Description | Unit | Value |
|---|---|---|
| Manufacturer | - | JEUMONT Electric |
| Rated power | kW | 480 |
| Rated apparent power | kVA | 7800 |
| Rated voltage | kV | 10 500 |
| Rated current | A | 429 |
| Rated frequency | Hz | 50 |
| Rated power factor | - | 0,8 |
| Rated speed | rpm | 1000 |
| Rated efficiency | % | 97,15 |
| Number of poles | - | 6 |
For dynamic calculations we also need generator capability curve. It shows relation between active and reactive power. Example of generator capability curve is in Fig. 1.
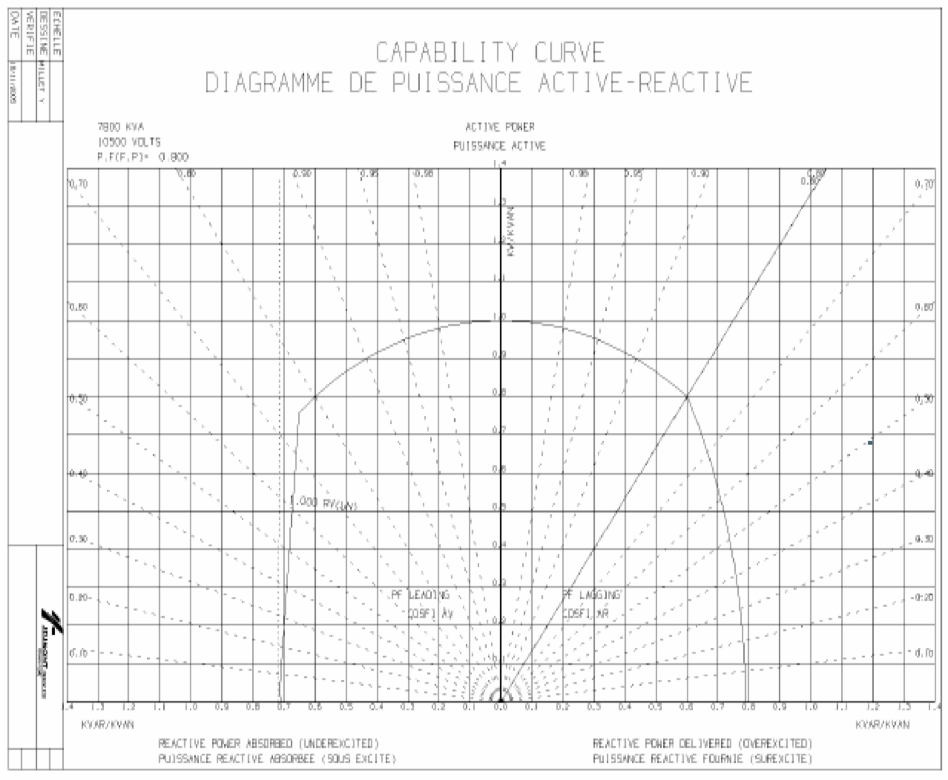
Fig. 1. Capability curve
4. Dynamic calculations
For Transient stability and Motor acceleration analysis was used scheme in Fig. 2. In this scheme an asynchronous motor and a static load is supplied by power from a synchronous generator. (used Electrical Data of motor [5])
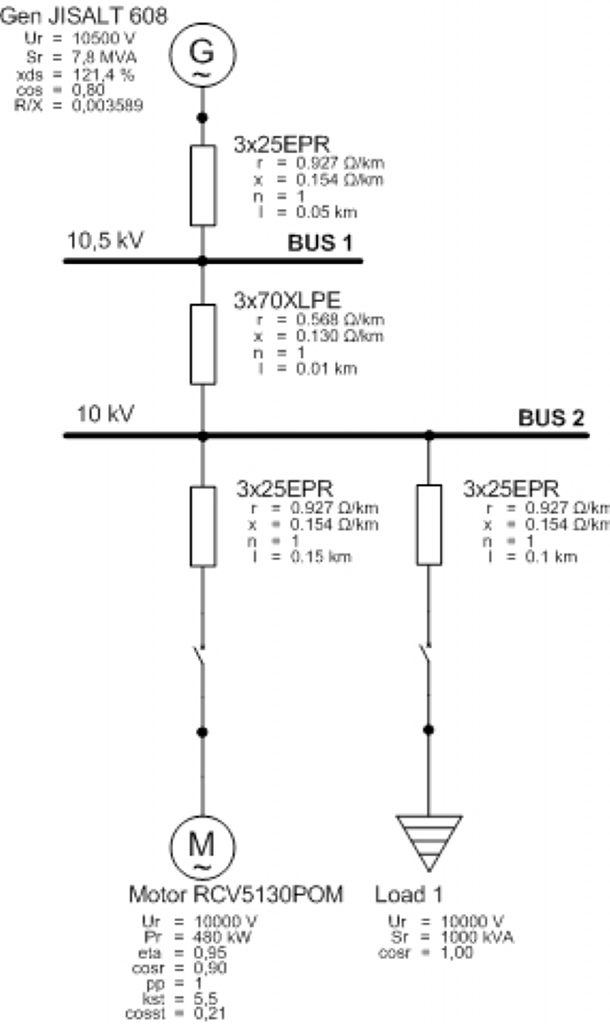
Fig. 2. Electrical grid
4.1 Basic equation verification
To gain the most accurate results is needed to verify values of rated power, voltage and current provided by manufacturer. Some of these values (e.g. rated current) can be estimated by program ETAP with a deviation affecting the results. Basic equation for calculating electrical and mechanical power of generator is:
 |
(1) |
Where Pm is mechanical power, Pel is electrical power that is specified by generator designer (apparent power) and 
 |
 |
Verification of the equation (with the rated efficiency 0,917):
 |
(2) |
The deviation between Pm from the graph and from the equation is inappreciable small so the equation could be considered as validated.
4.2 Step load sequence
For this part was used electrical scheme shown in Fig. 3. Load was divided into 6 smaller loads connected one by one with a small time step. The simulation has shown how big the electrical and mechanical power was given by the generator after connecting the loads. The prime mover governor (diesel engine) is operated in this case in isochronous speed control mode (see 4.3 The Governor).
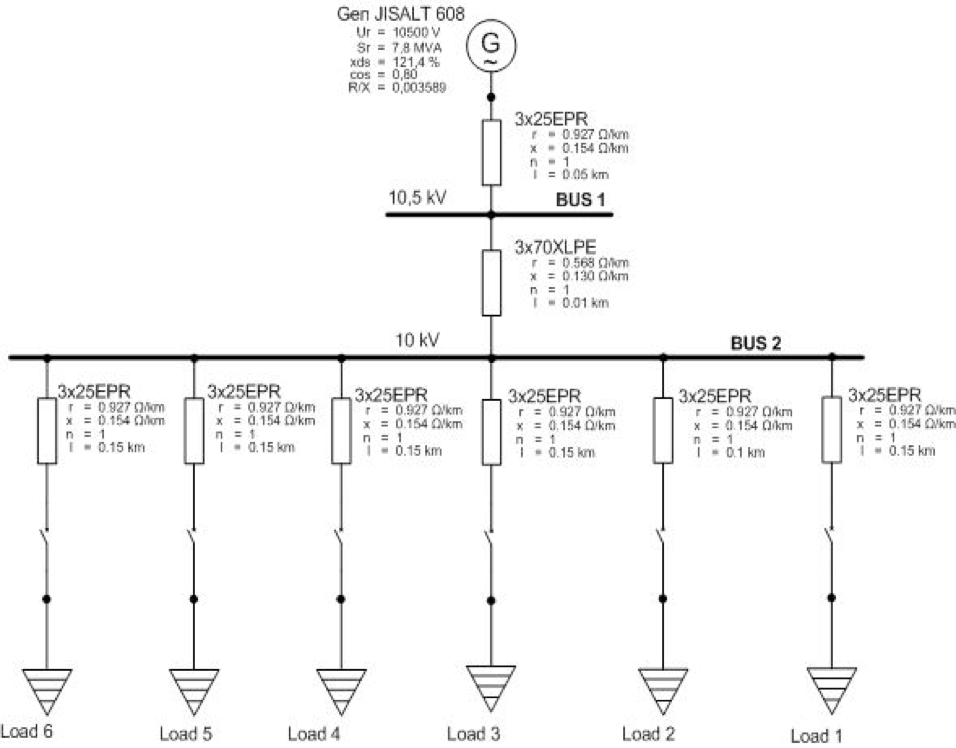
Fig. 3. Scheme for step load sequence
The electrical and mechanical power values of used loads are defined in Tab. 2 and Tab. 3.
Tab. 2. Step load sequence
| T | Loads | Gen JISALT 608 | |||||
|---|---|---|---|---|---|---|---|
| s | kW | kVAr | PF | kW | kVAr | PF | |
| 2 | Load1 | 1120 | 840 | 0,8 | 1230 | 915 | 0,8 |
| 15 | Load2 | 1200 | 0 | 1 | 2540 | 915 | 0,94 |
| 30 | Load3 | 1088 | 959 | 0,75 | 3724 | 1956 | 0,88 |
| 45 | Load4 | 1425 | 1900 | 0,6 | 5248 | 3993 | 0,8 |
| 65 | Load5 | 2200 | 1650 | 0,8 | 7581 | 5725 | 0,8 |
| 85 | Load6 | 2600 | 855 | 0,95 | x | x | X |
Power factor of the generator was taken from Fig. 1. In this step was used different power factor of loads from the rated power factor of the generator. Time dependence of the electrical power of the generator while the loads are connecting is in Fig. 4.
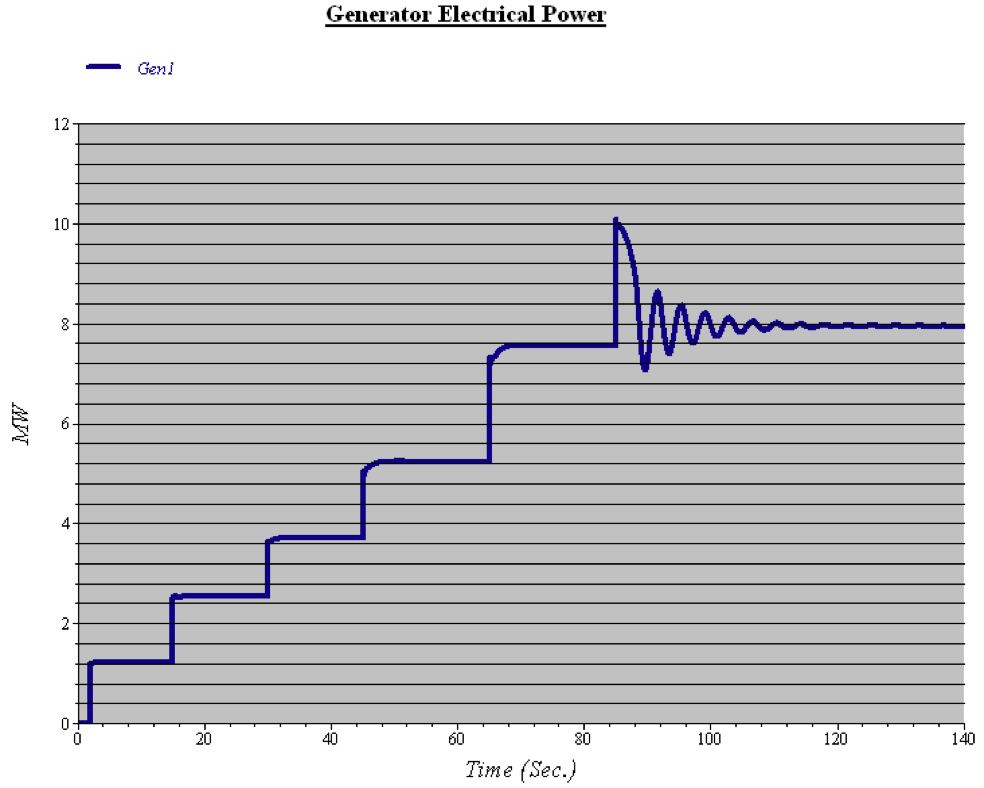
Fig. 4. Generator electrical power , step load
Time dependence of the reactive power of the generator while the loads are connecting is in Fig. 5.
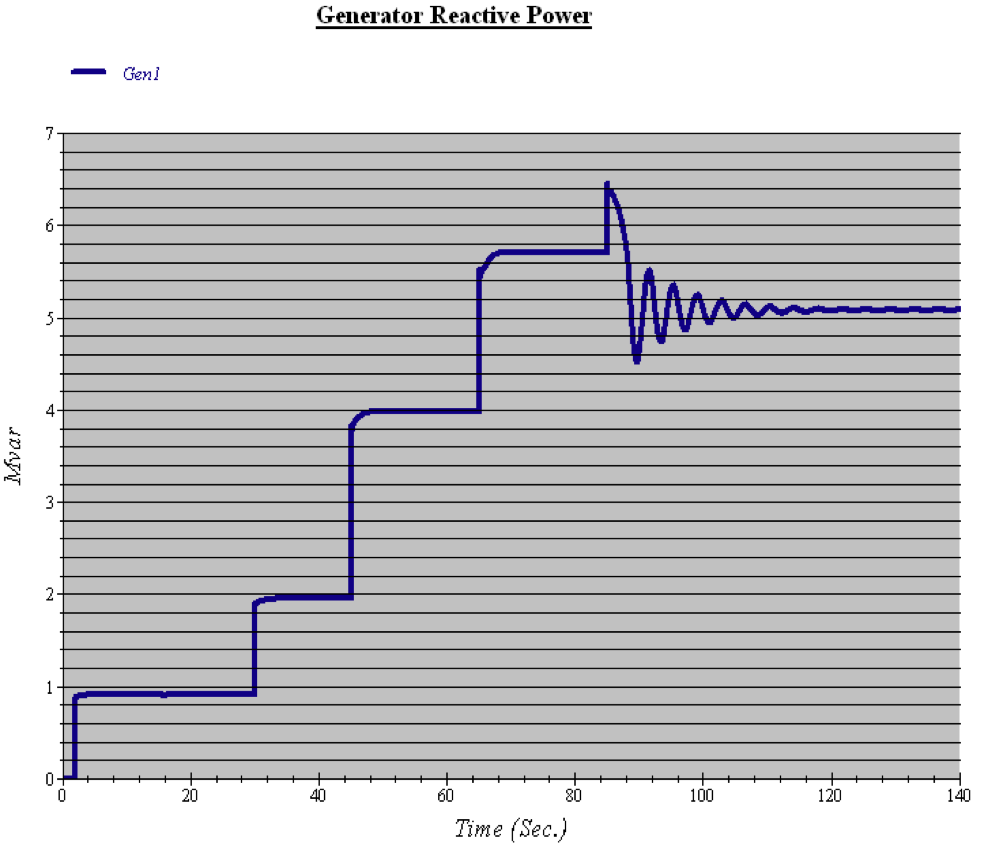
Fig. 5. Generator reactive power, step load
In the last step of step load sequence the connected load is bigger than the set value of maximal mechanical power on the generator shaft. There occurs unbalance between mechanical and electrical power. Generator falls out of synchronism, so the speed decreases. (Fig. 6)
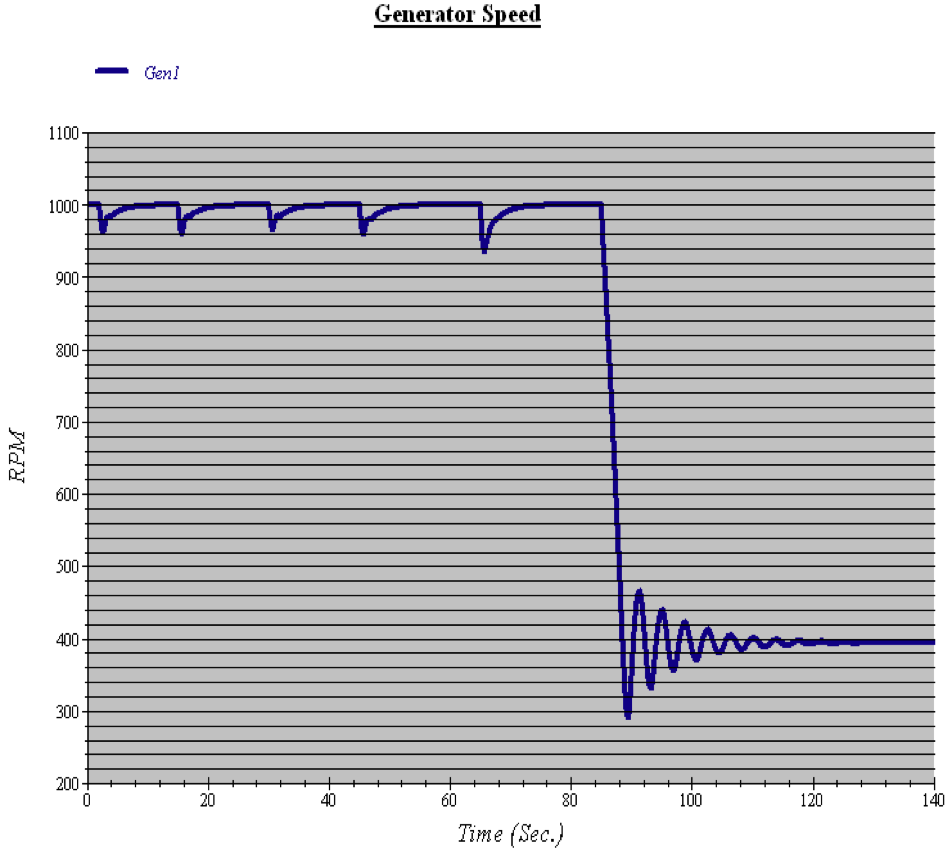
Fig. 6. Generator speed, step load
In the next step was used loads only with the rated power factor (PF=0.8), sum of the loads equals rated load of the generator given by manufacturer. Mechanical power on the generator shaft was increased in case of not falling out of synchronism. Values of connected loads, generator electrical and mechanical power (from simulation) and generator power factor (from Fig. 1) are in Tab. 3.
Tab. 3. Step load sequence 2
| T | Loads | Gen JISALT 608 | |||||
|---|---|---|---|---|---|---|---|
| s | kW | kVAr | PF | kW | kVAr | PF | |
| 2 | Load1 | 500 | 375 | 0,8 | 553 | 405 | 0,8 |
| 15 | Load2 | 1000 | 750 | 0,8 | 1646 | 1225 | 0,8 |
| 30 | Load3 | 1500 | 1125 | 0,8 | 3276 | 2443 | 0,8 |
| 45 | Load4 | 1500 | 1125 | 0,8 | 4891 | 3647 | 0,8 |
| 65 | Load5 | 1500 | 1125 | 0,8 | 6490 | 4837 | 0,8 |
| 85 | Load6 | 2000 | 1500 | 0,8 | 8600 | 6400 | 0,8 |
Time dependence of electrical power of the generator while the loads are connecting is in Fig. 8.
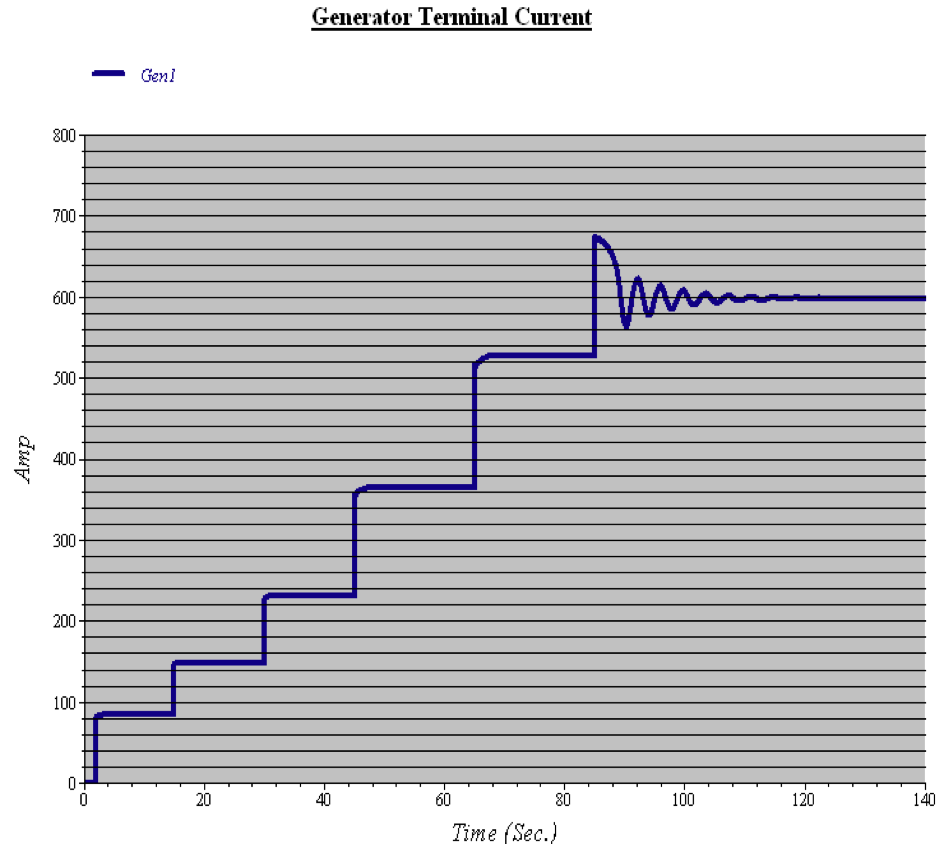
Fig. 7. Generator terminal current
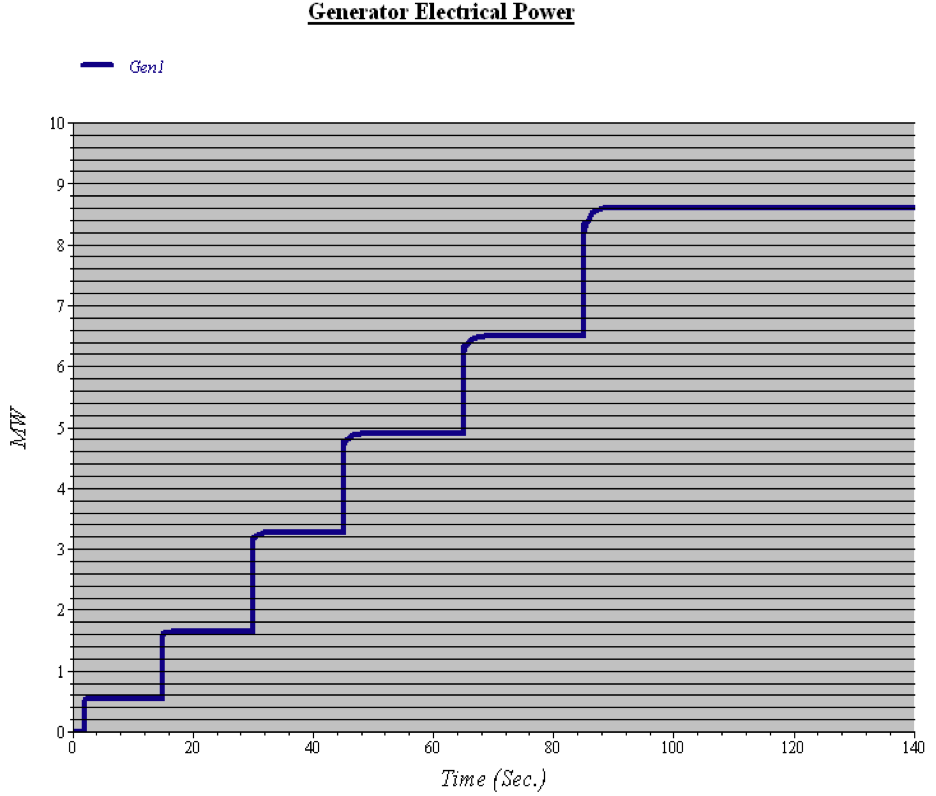
Fig. 8. Generator electrical power, step load 2
After connecting load5 the current that flows through the generator is bigger like the rated current (Irated=429A) of the generator so the generator is overloaded (see Fig. 7). Time dependence of reactive power of the generator while the loads are connecting is in Fig. 9.
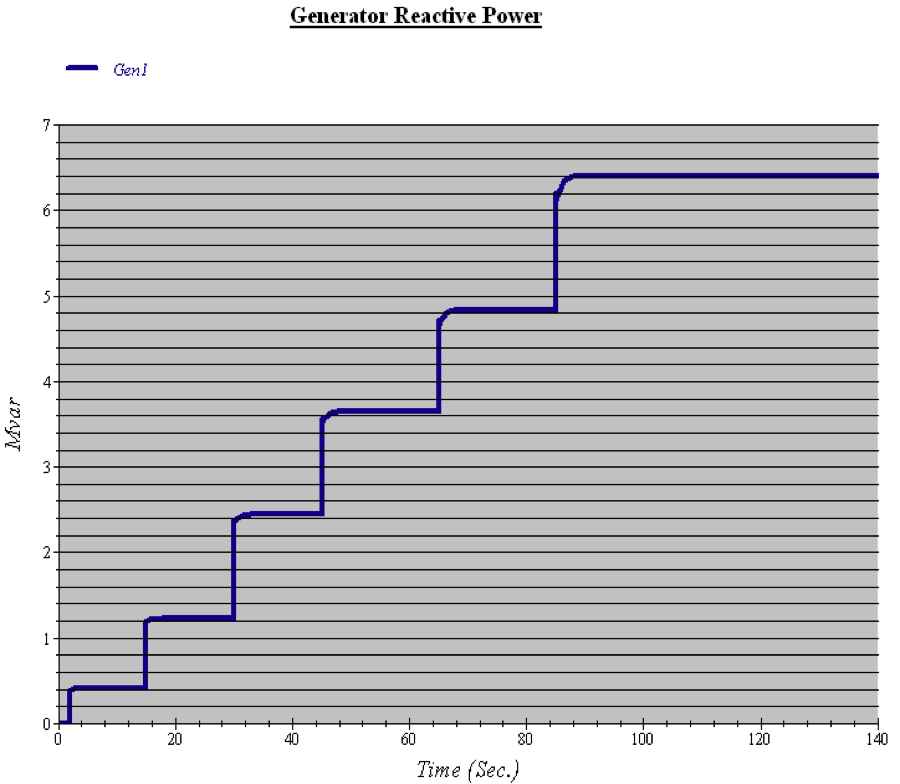
Fig. 9. Generator reactive power, step load 2
For this case the sum of the connected load and power loss in cables is equal to electrical power of the generator. It’s necessary to enlarge mechanical power on the generator shaft in order to not falling out of synchronism. Prime mover of the generator is device that keeps generator in synchronism. Its mechanical power must be able to cover sum of all electric power of the connected loads. The sum of all electric power of the connected loads must be smaller or equal to the limit value of the capability curve. If the sum of all electric power of the connected loads is bigger than limit value of the capability curve the generator is overloaded (See Fig. 1). In this case is shown that if mechanical power on the shaft of the generator is bigger than sum of all connected loads, the generator is still able to work in overloaded mode. This operational status is inadequate for the generator as falling out of synchronism.
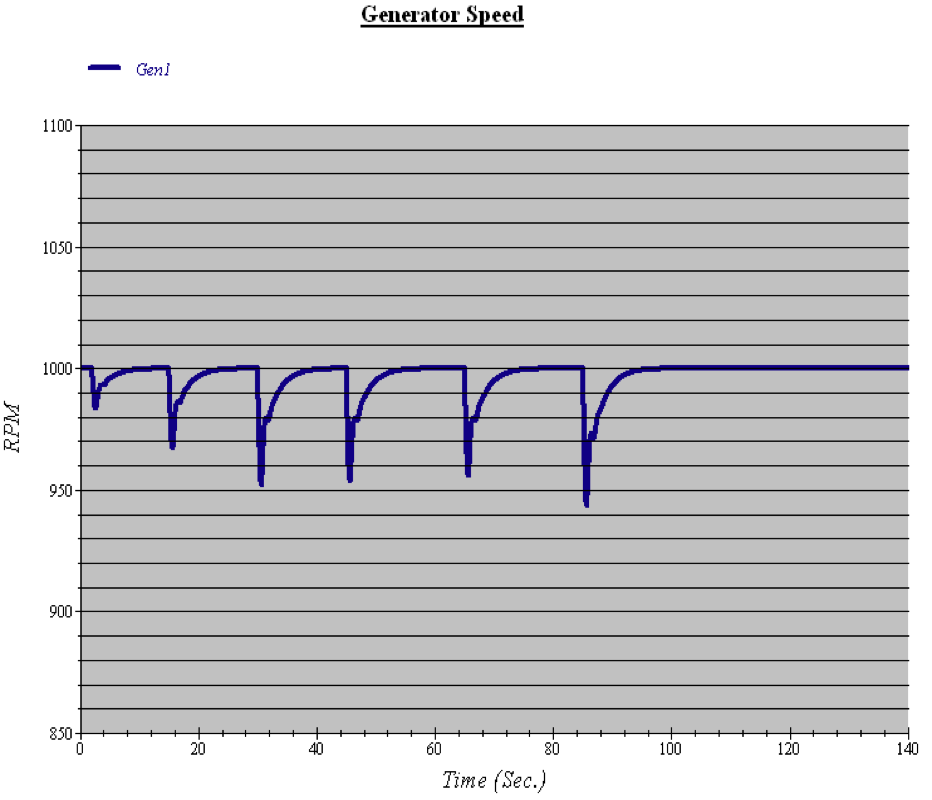
Fig. 10. Generator speed, step load 2
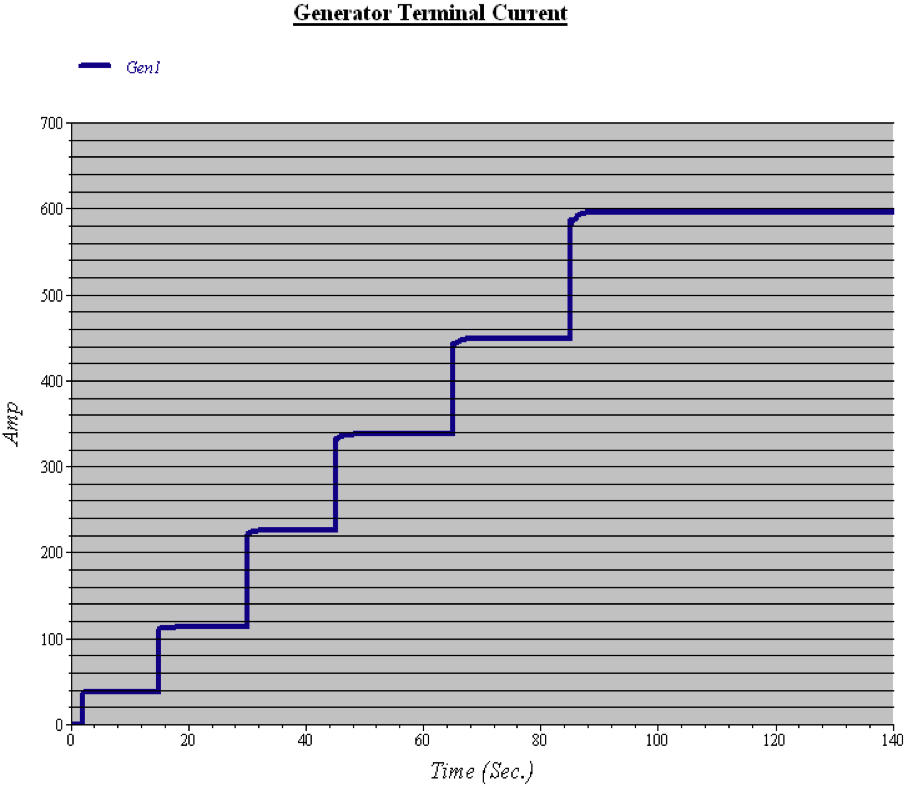
Fig. 11. Generator terminal current
4.3. The Governor
This part describes the representation of speed governing and prime mover control systems for synchronous generators. The governor is a device used to measure and regulate the speed of a machine. In isochronous speed control mode, energy being admitted to the prime mover is regulated tightly in response to changes in load which would tend to cause changes in speed, so the speed is still maintained by prime mover at the setpoint. For example see Fig. 12. Also see Fig. 10 where is used isochronous mode of the prime mover governor. After connecting the single loads is still maintained the rated speed until the generator is overloaded with the last load.
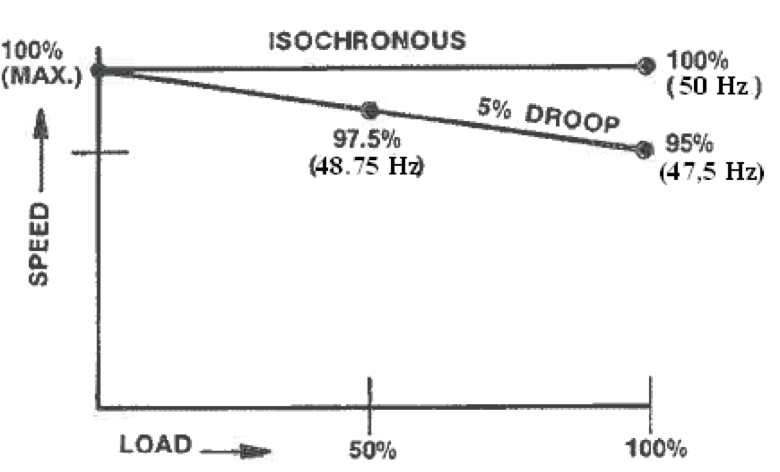
Fig. 12. Isochronous and Droop mode definition
Droop mode is defined with a decrease in speed setting of generator as the load increases. Speed droop is a decrease in speed or frequency, proportional to load. If the load increases, then the speed or frequency decreases (drops). Speed droop is expressed as the percentage reduction in speed versus the speed setpoint that occurs when the generator is unloaded.
 |
(3) |
In Fig. 13 the line is defined with speed at 0% load and speed at 100% load. The line shows ideal values of decreased speed at load from 0% to 100% load at defined droop. At 100% load the generator speed decreased from 1000 RPM to 925 RPM (see Fig. 14). Difference between them is 7.5% that equals 3.75Hz of 50Hz rated frequency of the generator. Relation between generator frequency and speed of generator:
 |
(4) |
Where n is speed in rpm, f is frequency in Hz and p is number of pairs of poles.
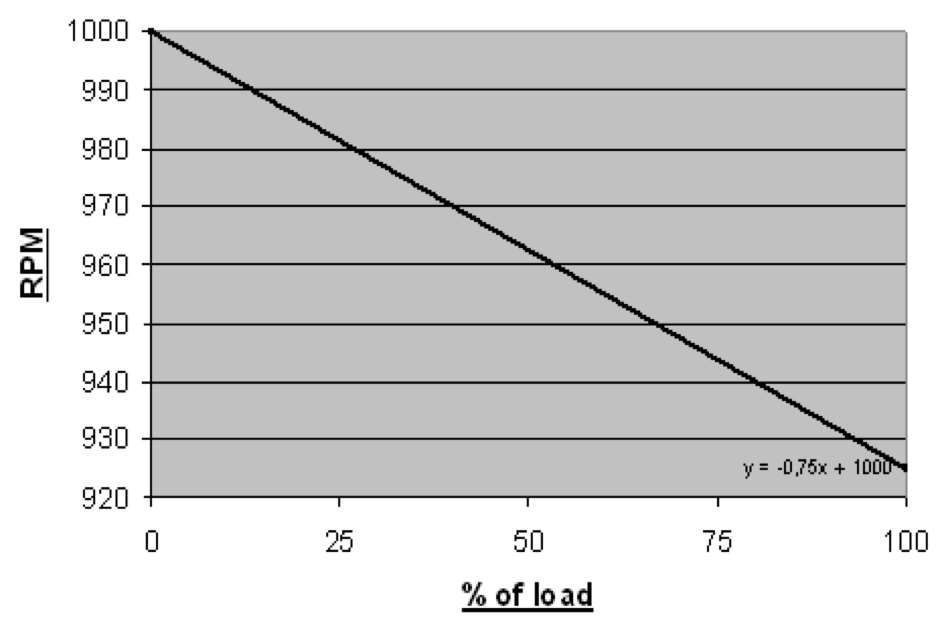
Fig. 13. Speed decrease characteristic
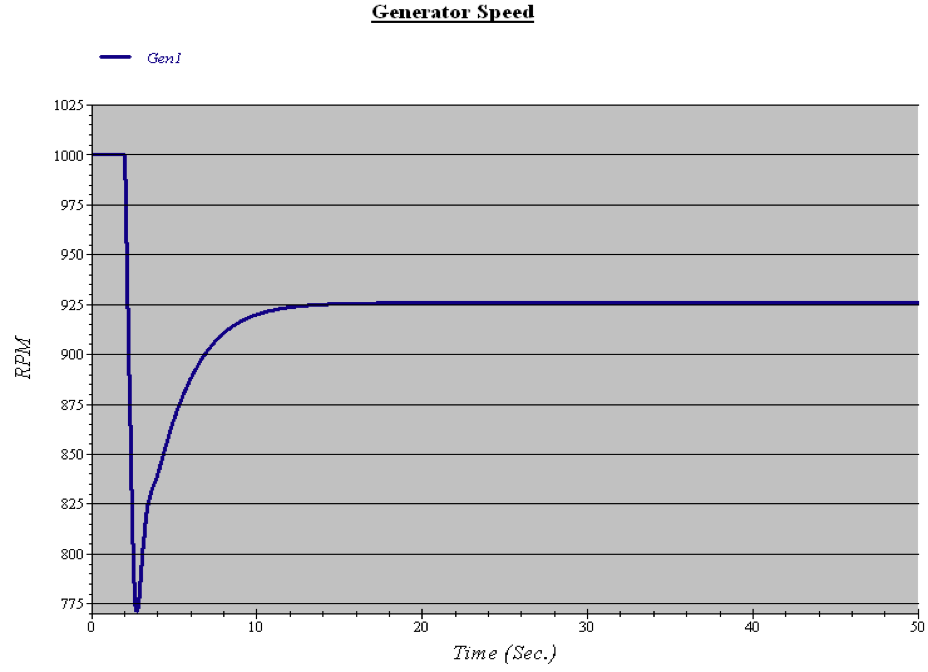
Fig. 14. Generator speed decrease at rated load
In Tab. 4 are compared values of generator speed after application of load at 100%, 75%, 50%, 25% from the simulation and ideal values from graph Fig. 13. There can be seen negligible differences between compared values.
Tab. 4. Speed droop
| Load | Simulation RPM | Speed decrease characteristic RPM |
|---|---|---|
| 100% | 925 | 925 |
| 75% | 944,1 | 943,75 |
| 50% | 962,5 | 962,5 |
| 25% | 981,1 | 981,25 |
5. Conclusion
In conclusion of step load sequence calculation of synchronous generator is shown, that due to the risk of fall out of synchronism is even small overloading of generator important to take into account. To avoid generator overloading is necessary to know the sum of loads, which represent all devices in scheme and use generator with enough power. In governor calculating is verified, that this device regulates speed of prime mover according to adjusted speed characteristic. There are no noticeable speed decreases in the governor isochronous mode, the speed is still maintained on the same value. But when operating with governor in droop mode, there are noticeable speed decreases according to size of the connected load, which depends on defined value of defined decrease in speed setting of generator. In further studies of synchronous generators will be closely analyzed excitation systems of generators, their prime movers responding to aspects of electrical grid, globally dynamic calculations of synchronous generators.
Acknowledgements
Research described in the paper was supported by AREVA NP Controls, s.r.o.
References
- ETAP Operational Technologz, INC., ETAP 11.0.0, Product overwiev, B8-PO-E11-0911-15
- ETAP for electrical power systems, ONLINE HELP, 18.03.2013,
http://etap.com/index.htm - Hruškovič L., Elektrické stroje, Bratislava: Vydavateľstvo STU, 1999, 497p., ISBN 80-227-1249-3
- Electrical data provided by JEUMONT electric, Generator data sheet
- Electrical data provided by SCHORCH, Motor data sheet
Coauthors of paper are Marián Halaj and Peter Klopan.


06. August, 2016 o 14:36
as for simulation in MATLAB…FOR MY PROJECT..